
Analytics
Every number about your event, in one page.
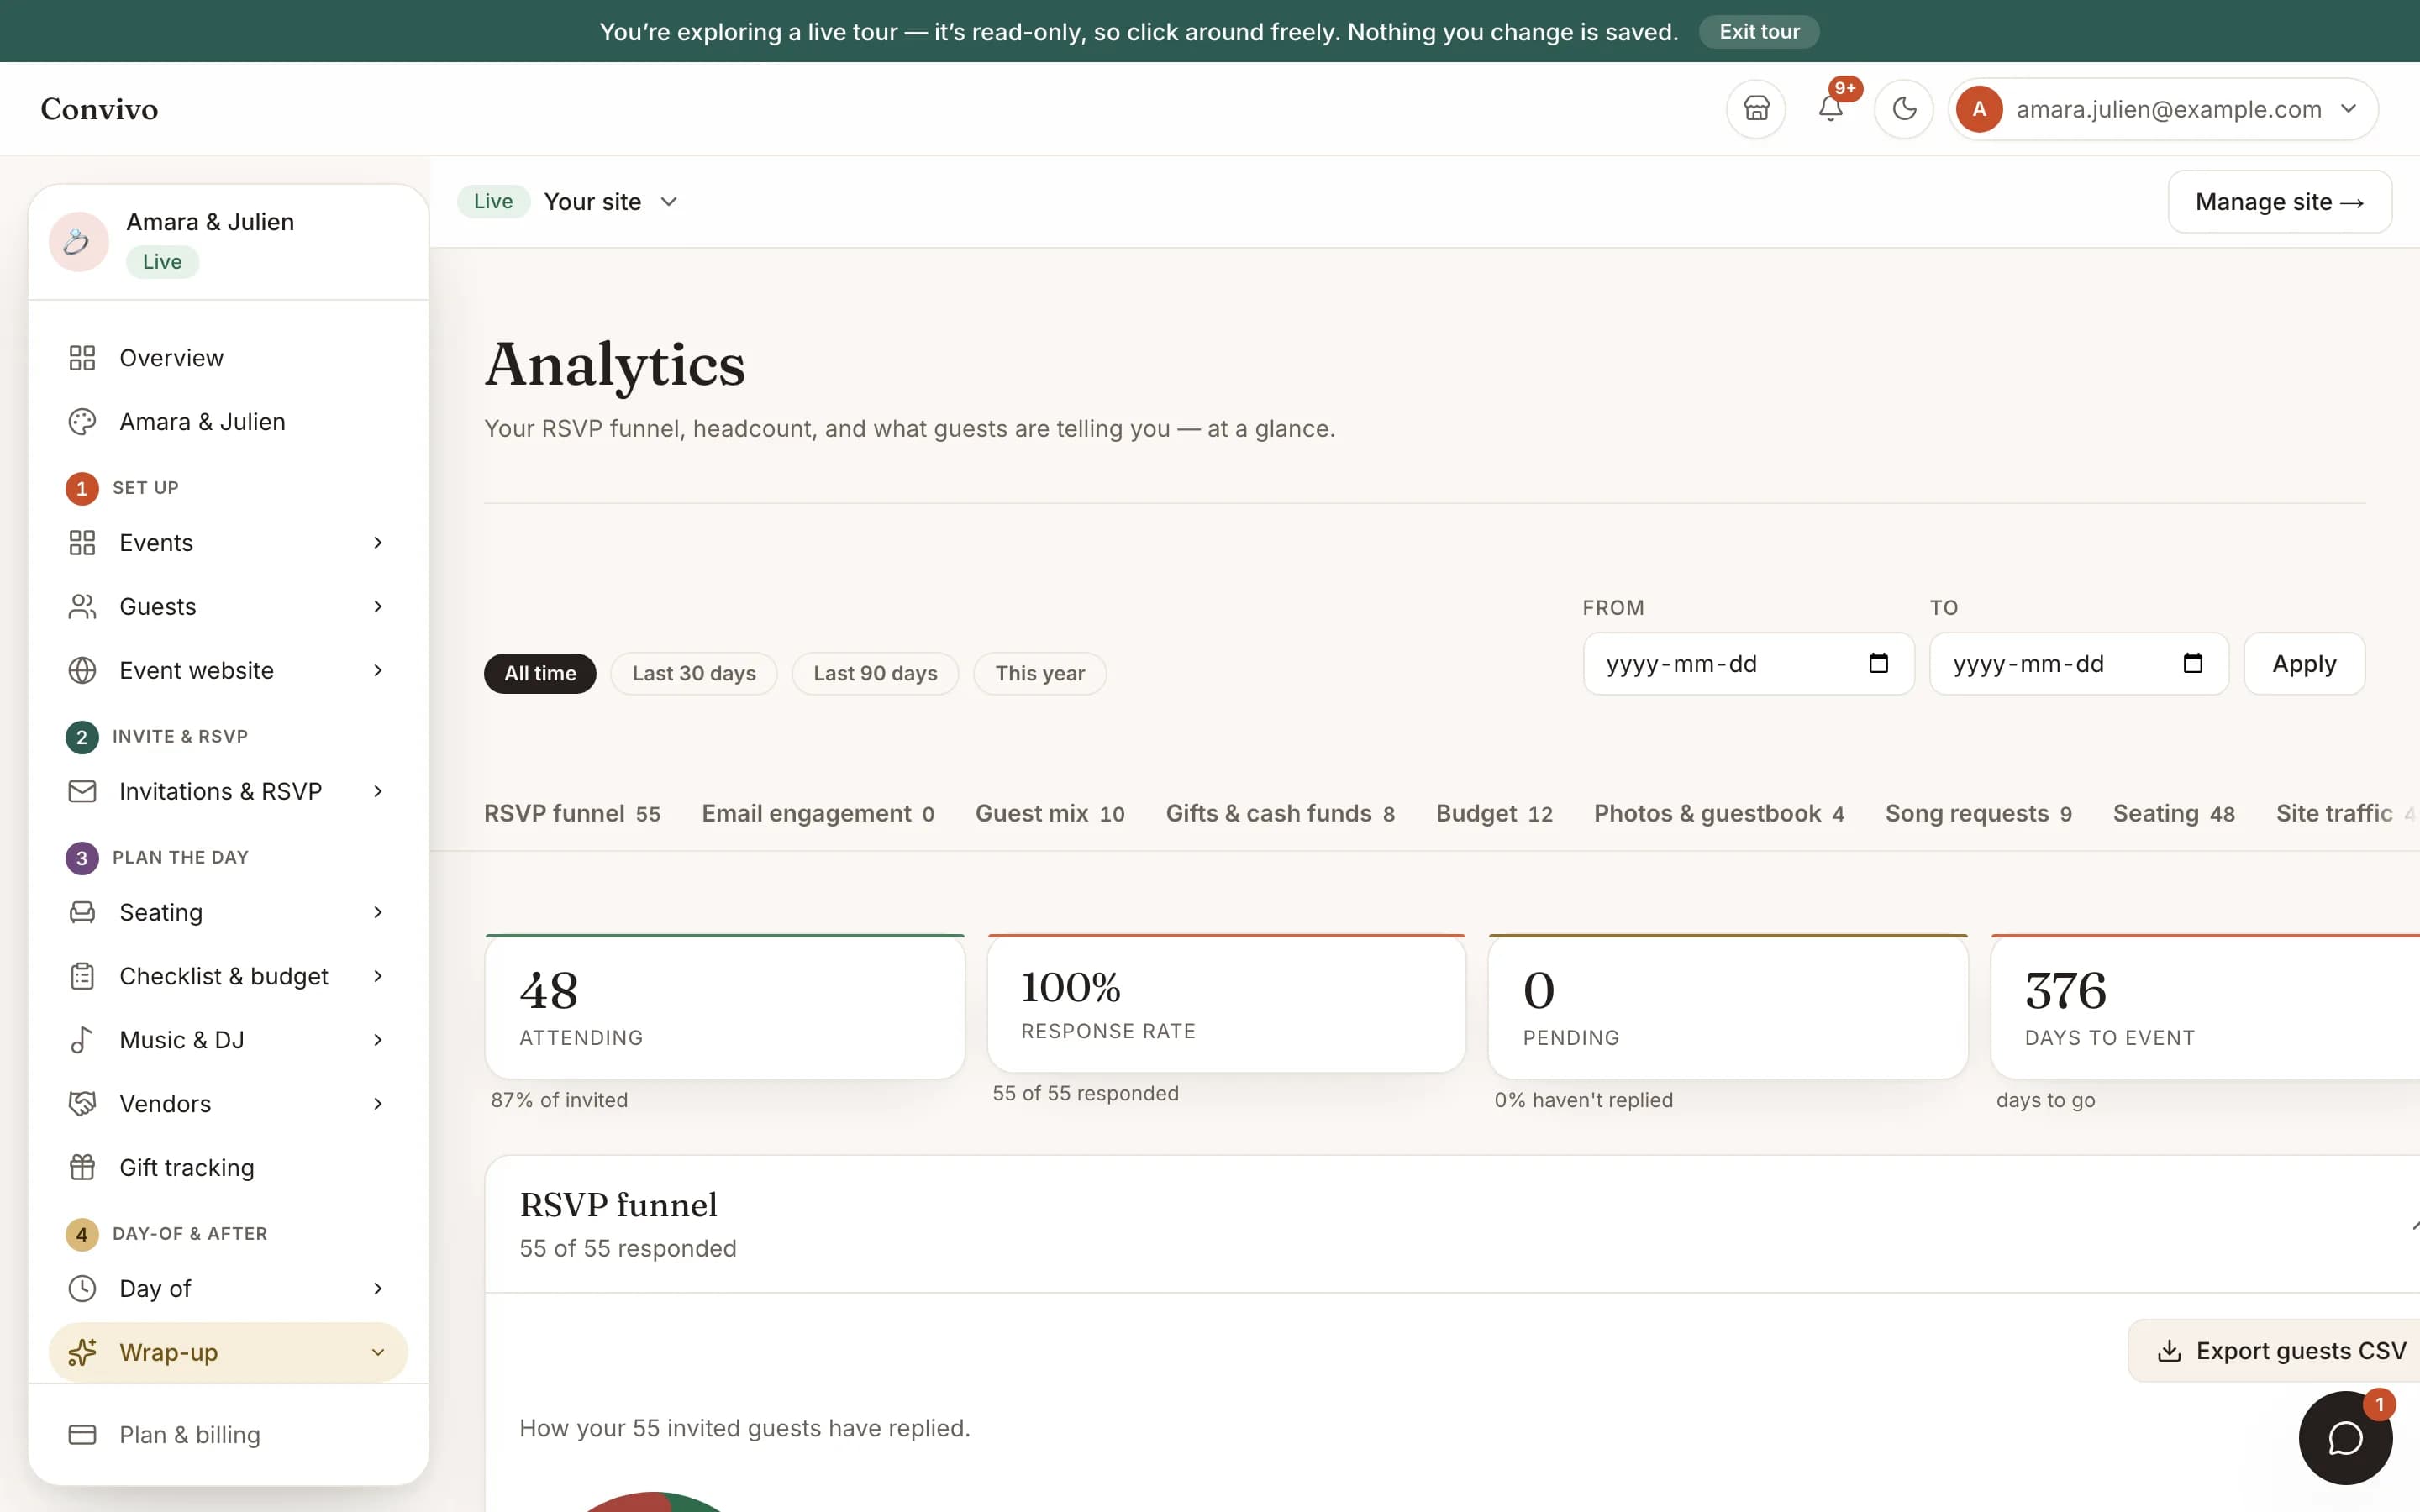
RSVP funnel, response rate, headcount, gifts, budget, photos and guestbook activity, song requests, seating, even who is visiting your site: one page with a tab for each, filterable by date range.
- RSVP funnel, response rate and headcount at a glance
- A tab for guests, gifts, budget, photos, music, seating and site traffic
- Filter by a preset range or your own dates
How it works
Three steps, start to finish.
Open Analytics from your event
Find it under Wrap-up in your event's menu.
Pick a range
All time, a preset window, or your own start and end dates.
Move between tabs
RSVP funnel, guest mix, gifts, budget, photos and guestbook, song requests, seating and site traffic each get their own tab.
Straight from the product
The screen itself, unretouched.
The illustration at the top of this page was built from this exact capture, down to the labels and the counts.
What it connects to
Analytics does not work alone.
No-login RSVP
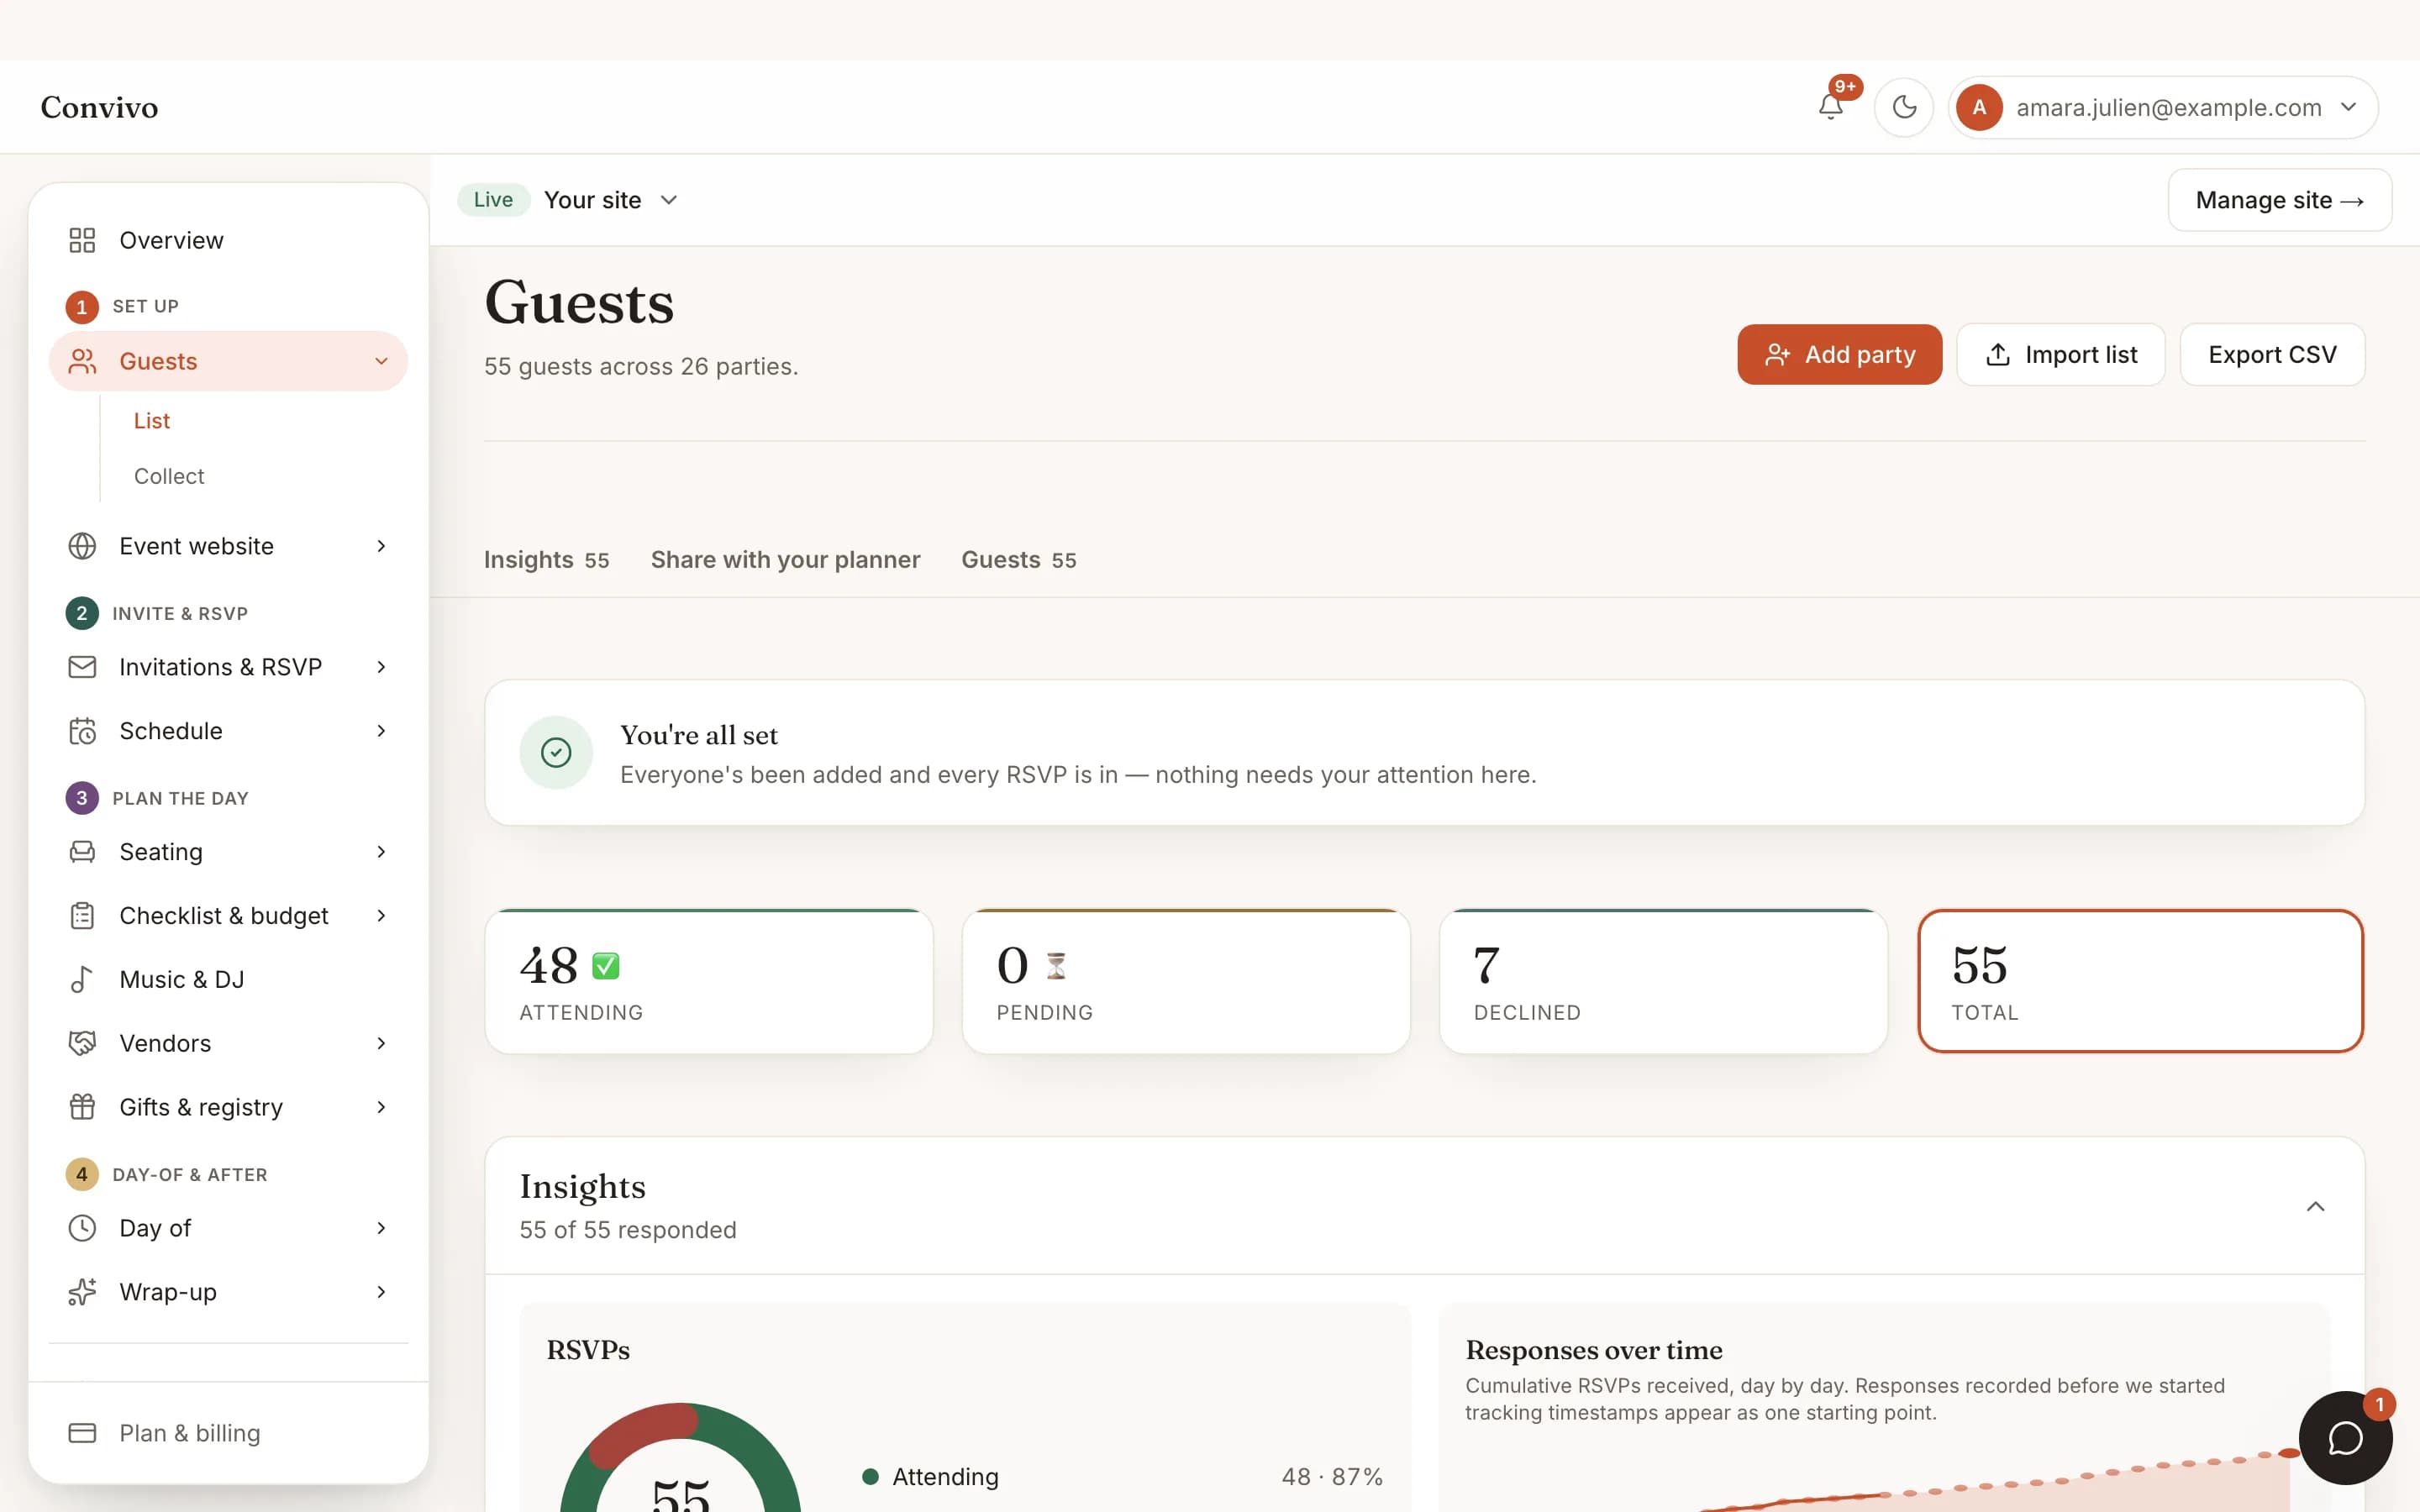
The funnel here is built from the exact same RSVP data your guest list tracks.
See No-login RSVP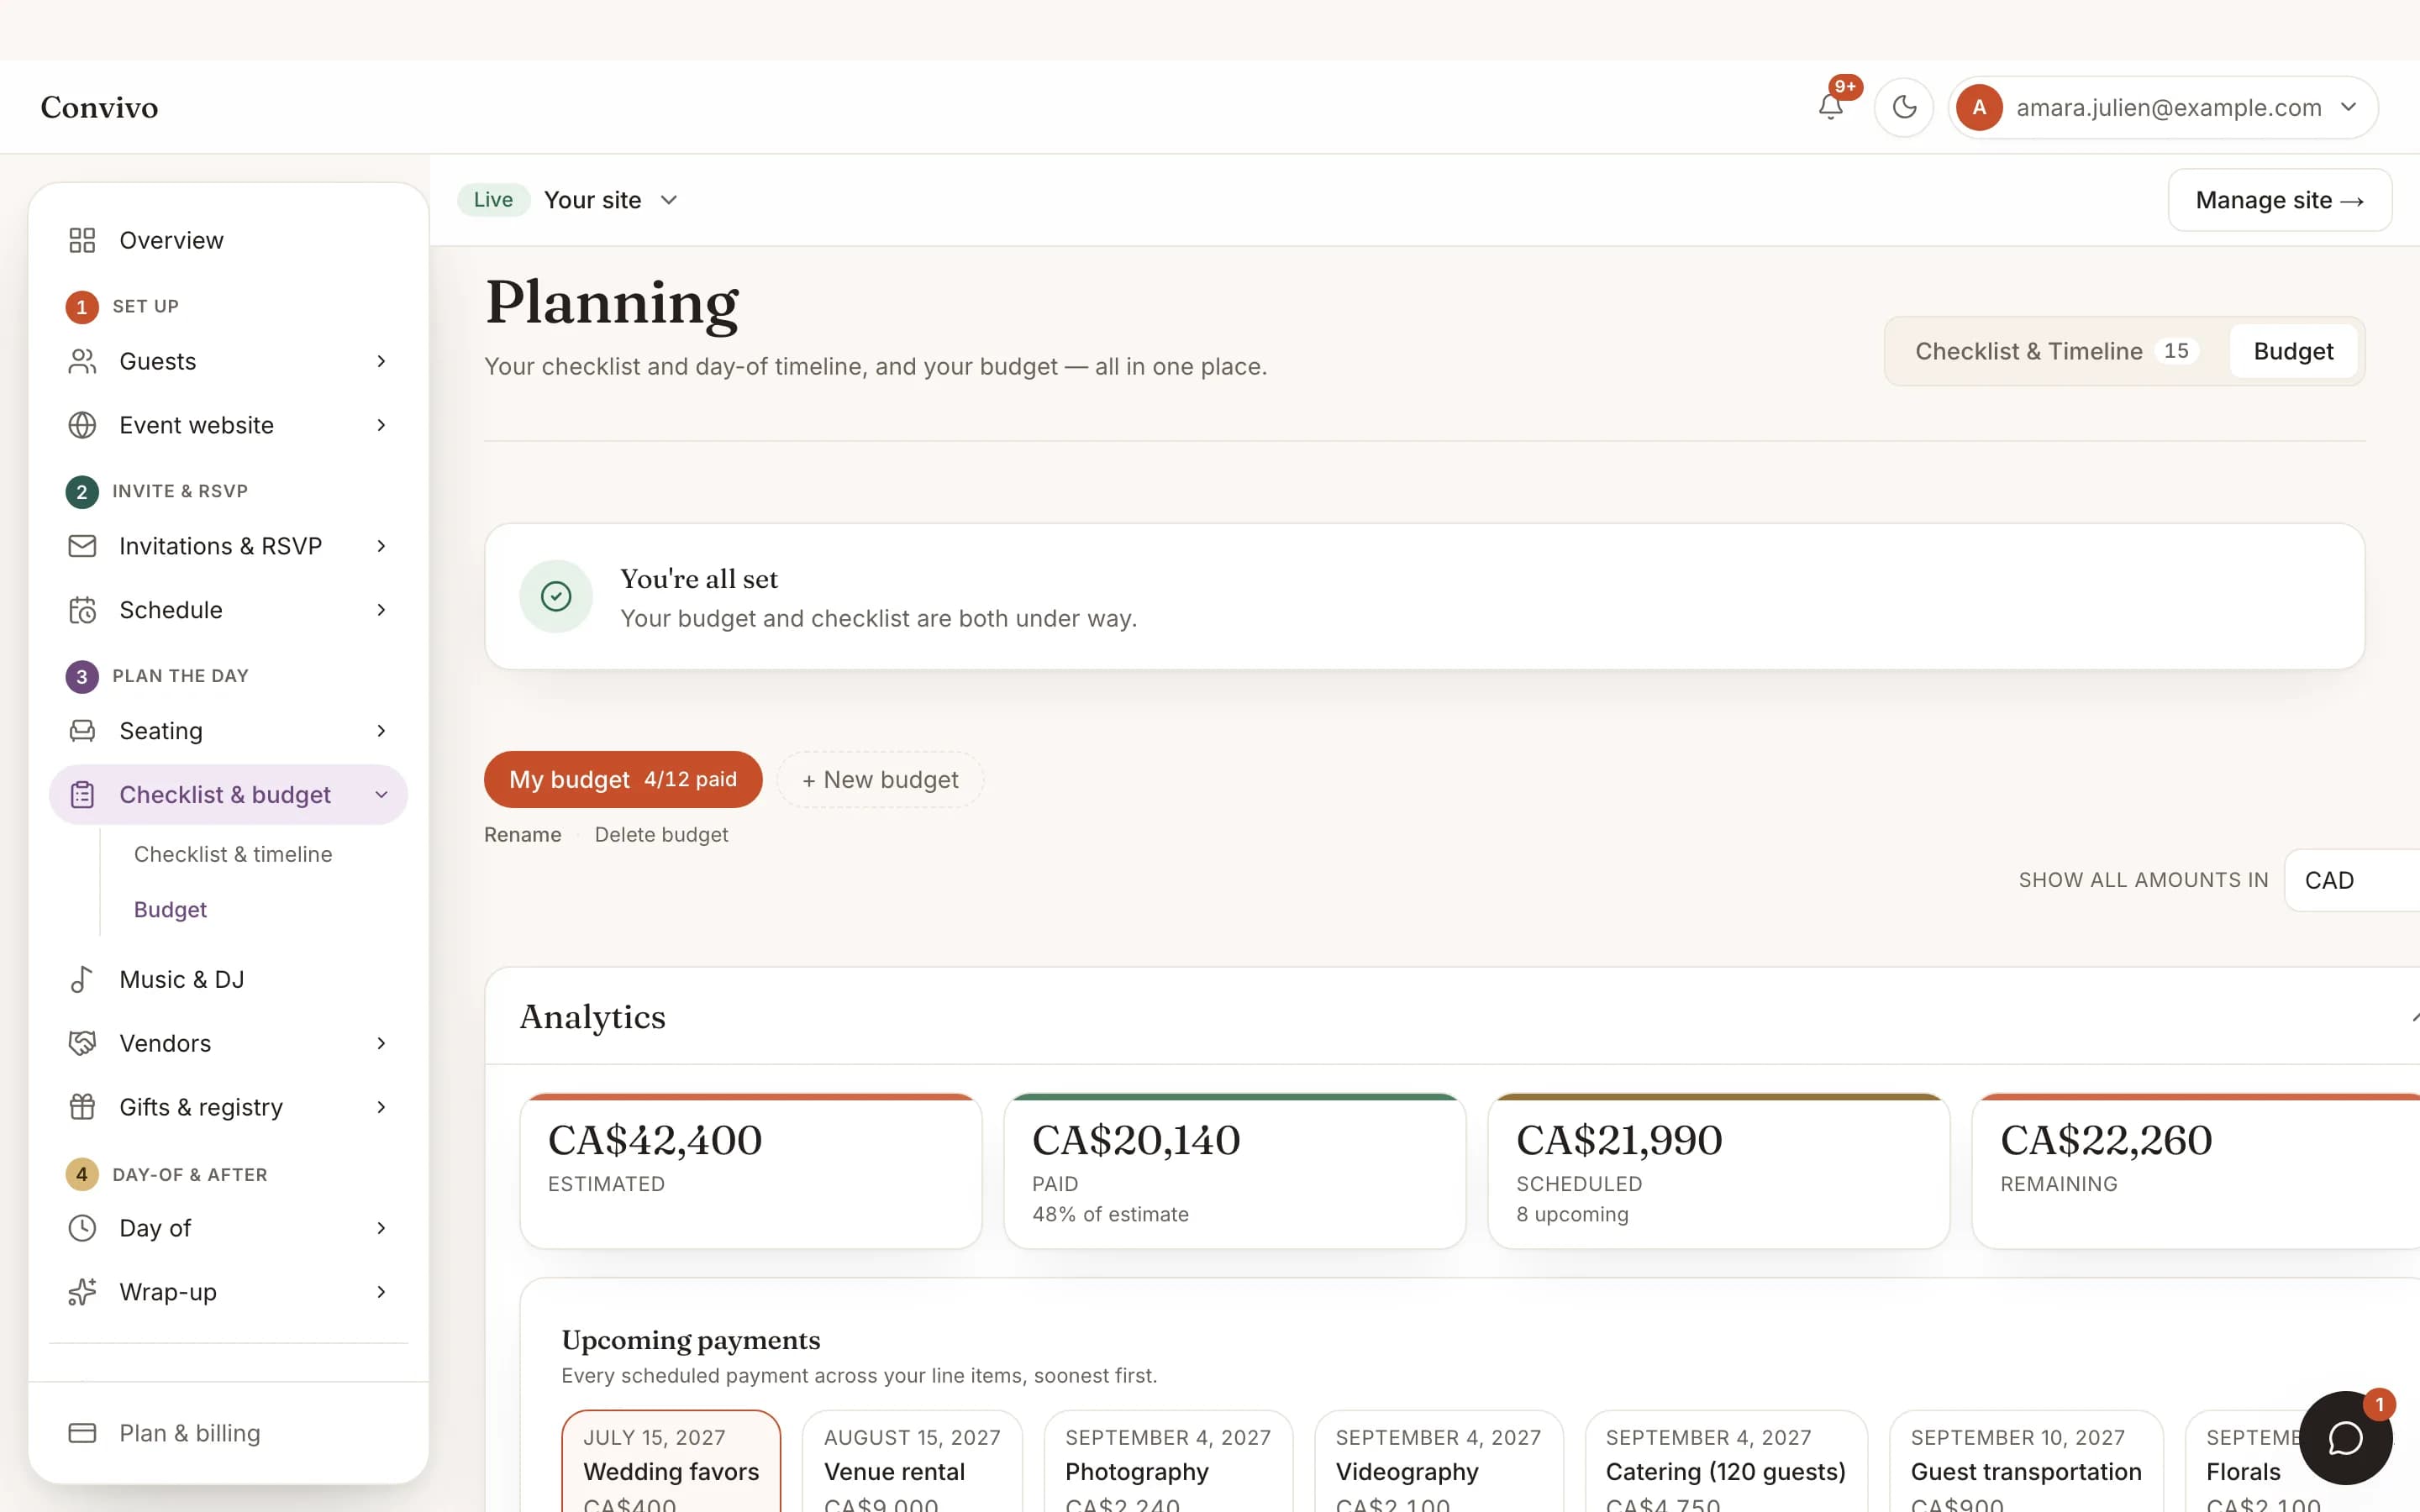
Budget tracker
The budget tab mirrors the numbers on your budget page, filtered to the same date range.
See Budget tracker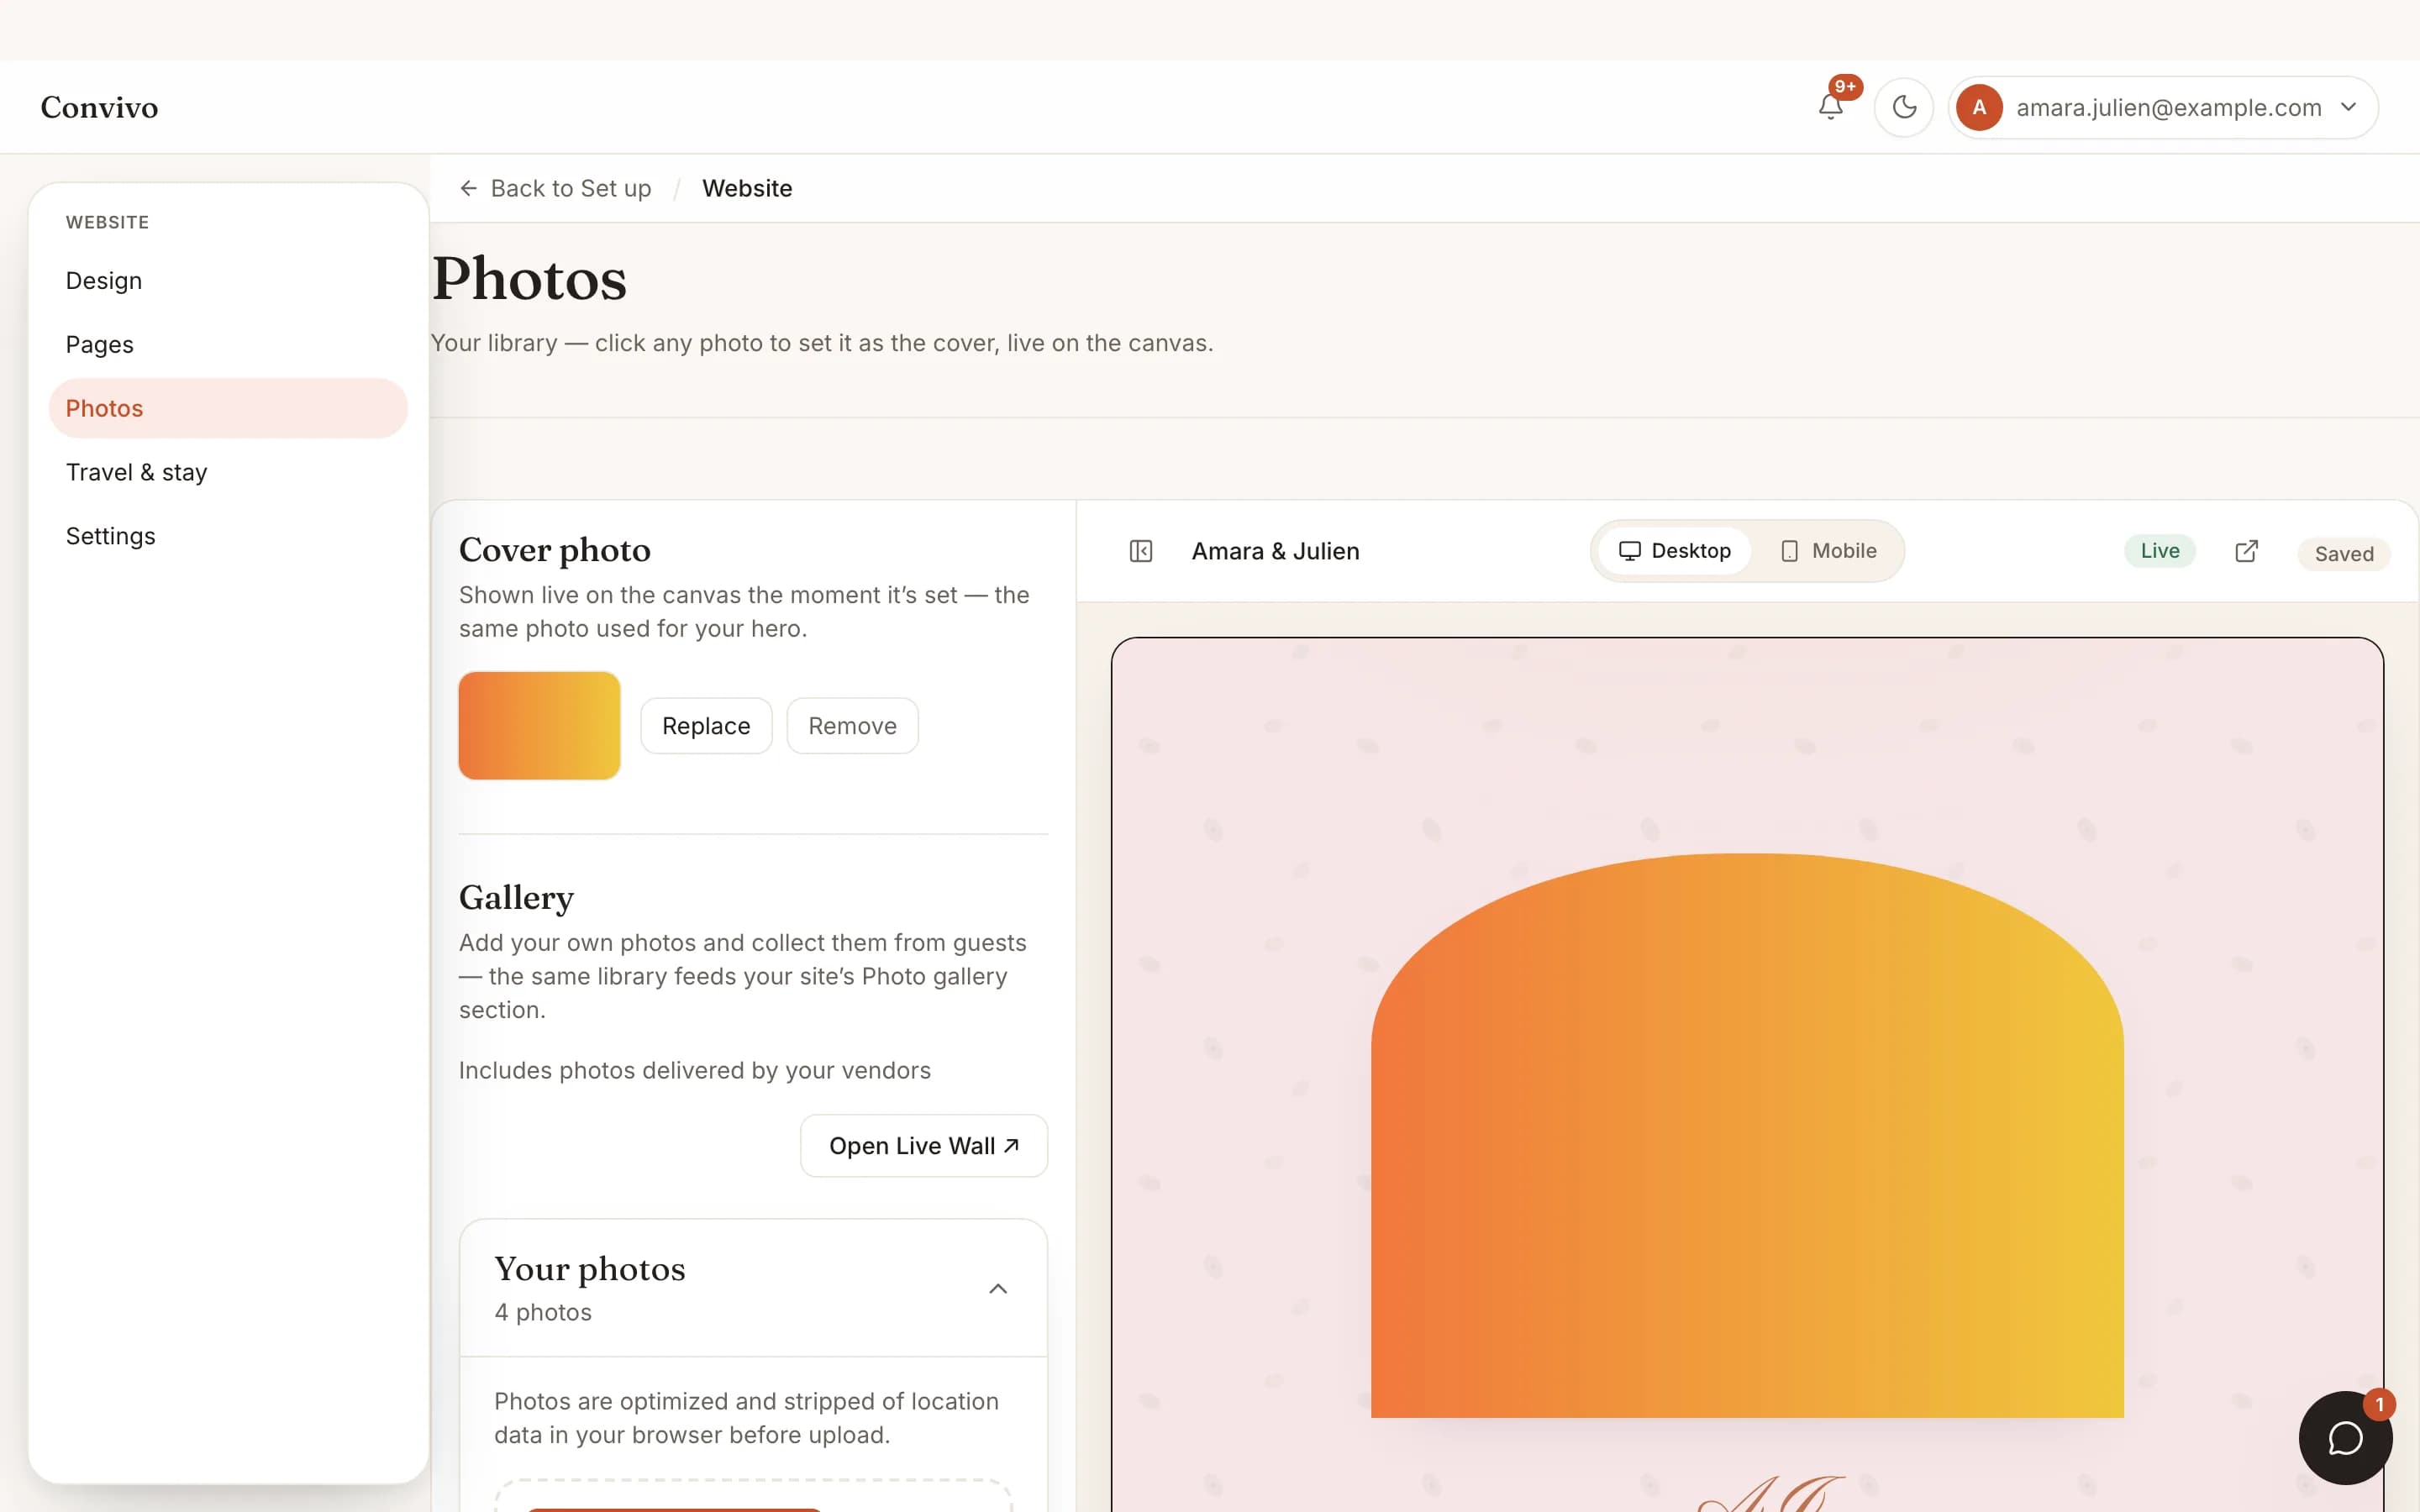
Photos & live wall
Photos and guestbook activity roll up here too, alongside everything else.
See Photos & live wallHonest answers
Frequently asked
Is this the same page as guest RSVP tracking?
It draws from the same data, but this is the single page that also covers gifts, budget, photos and more.
Can I filter by a specific date range?
Yes, pick a preset window or set your own start and end dates.
Is there a vendor version of this?
Yes, a separate business-facing Analytics page (win rate, lead sources, revenue) exists for vendors on their own portal; this page is the host-facing one.
Does this cost extra?
No, Analytics is part of every event.
Ready to put this to work?
Start free, and this exact page fills in with your own event.